


If you navigate using vector charts alone, says Tom Cunliffe, you’re heading for unseen trouble

How to use vector charts safely
Back in February the Royal Institute of Navigation ran an evening lecture and discussion on the navigational significance of the loss of Team Vestas Wind, the Volvo boat that piled up on the Cargados Carajos in the Indian Ocean. As I listened to the commentary of Wouter Verbraak, the yacht’s navigator, I began to feel a strong sense of déja vu.
Disappearing reefs

Team Vestas Wind wrecked on the Cargados Carajos Shoal in the Indian Ocean
Seven years ago, I was an expert in litigation over an incident involving the loss of a cruising yacht. This one was in a different ocean, but the mistakes made were eerily similar. The skipper had planned his passage using vector charts of the sort loaded into the plotters on many of our bulkheads, computers or tablets. The first he knew of the reef that wrecked his boat was when he hit it. He had looked at the vector charts and found nothing to suggest that it existed. He therefore assumed he had crashed into an uncharted danger.
In fact, both reefs have been well known for a long time. Cargados Carajos was surveyed by Captain Sir Edward Belcher CB of HMS Samarang in 1846. It is almost double the length of the Isle of Wight. When I received instructions to report on the case of the cruising yacht, I first noted the lat/long position of the wreck.
Not having immediate access in my office to the vector charts that had been used, I fired up my laptop, which contains ARCS (Admiralty Raster Charts, faithful electronic scans of paper charts) for the world. The first chart I opened up was for the whole Indian and Western Pacific Oceans, Scale 1:20,000,000. The reef was on it and it was named. Bringing up more detailed charts revealed further features. A similar glance at the raster chart for the whole Indian Ocean showed the named reef hit by Team Vestas Wind. Perusal of the vector chart for the cruising yacht incident hadn’t revealed the reef until I zoomed in to a piece of ocean little bigger than my local village green. No wonder the guy missed seeing it.
These are merely two examples. A dozen or so yachts are reportedly wrecked every year on reefs in the Fiji group. It seems reasonable, in light of the above, to assume that at least some of these have fallen into the same pit of error.
What is going wrong?
Why are yachts stranding on ‘uncharted reefs’? Clearly, the navigators didn’t spot any charted dangers on their projected tracks, but does that mean the chart didn’t have the data? More and more of us rely, to some extent at least, on vector charts. We deserve to know what goes wrong, why it does, and why it continues to do so.
Raster versus vector: are all charts created equal?
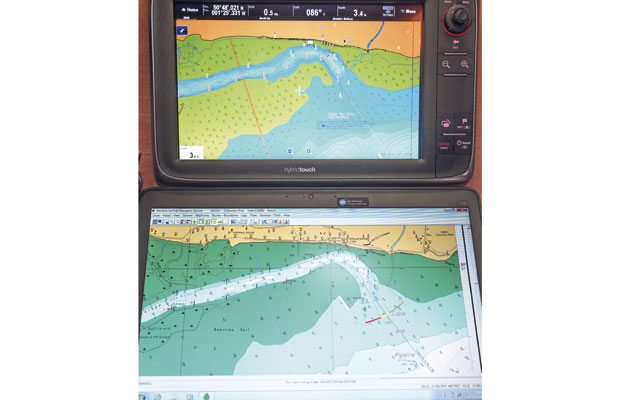
The raster chart (below) is an exact electronic facsimile of a paper chart, edges and all. The vector chart (above) stitches charts together and layers data for ease of use
A raster chart conforms to International Hydrographic Organisation specifications and is produced by digitally scanning paper charts. To all intents and purposes an ARCS chart is identical to the paper chart of which it is an electronic facsimile. It looks the same, has the same boundaries, is drawn to the same projection and uses the same survey data and corrections, all of which can be readily inspected. Even the notes that come with the paper chart are there. In fact, what you see is, literally, what you get.
The vector charts in our electronic devices are generated from data supplied from surveys by the world’s charting authorities. The data are basically similar to those used to draw paper charts. The US authorities state that the most accurate way to build electronic navigation charts (ENCs) is to recompile the paper chart from original source material.
Unfortunately, this is too labour intensive. Instead, they compile ENCs from source data on features deemed navigationally significant. Precise coordinates of channel limits are incorporated, and high-accuracy positions are used to chart aids to navigation. The paper chart remains the source for everything else. So you aren’t likely to find much on a vector chart that isn’t on the best-scale paper equivalent.
Decluttering

At the push of button…

…you can declutter the screen by removing layers of data. Just don’t forget you’ve done it
Many vector chart plotters, particularly older ones, have a declutter button. This has proved useful, but if we forget the screen is de-cluttered, we can come horribly unstuck. The same applies to cartography menus that allow the user to layer out all sorts of things – even wrecks and rocks in some programs. Forgetting that they were dumped yesterday can lead to disappointing tomorrows.
Zooming and panning

A paper chart can be folded to let you see all you need. ENCs need zooming and panning to see what’s off the screen
Whether it’s on a PC, a big-screen hardware plotter or, Lord save us, a mobile phone, all ENCs suffer from the same problem: the screens aren’t big enough. I often wish that the money squandered in producing useless ENC gimmicks would be channelled into R&D for larger screens burning fewer amps, but I suppose that is crying for the moon. Zooming or panning an ENC is the process of magnifying or shunting sideways what you are seeing to reveal what’s off the screen. With a paper equivalent, this is never more of an issue than having to fold it creatively. Even with a big 15-inch screen, zooming and panning are part of modern navigation.
Raster charts

My Meridian raster charts let you zoom, or ‘chart scale in’, to the point of pixellation. If there’s no smaller scale chart available, it lets you know
While a raster chart can be magnified until its pixels break down, it cannot be zoomed to reveal more detail. If this is required, then either the user or the software must bring up the next scale of chart.
On the Meridian program using ARCS, which I favour for my PC, I right-click on the area I need and am asked either to go ‘chart scale in’ which brings up the next detail level of chart, or ‘charts available’, which offers me the full selection. By this means I effectively grope in my electronic chart table and leaf out the most suitable chart from my folio. When it opens up, which it does in split seconds, I can see immediately if it has what I need. If not, I scale in again, and so on. When no further detail is available, that means the UKHO does not have it. It’s that simple.
Vector charts
Unlike its raster sister, vector charts are stitched together so there’s generally no need to choose a specific chart, beyond inserting the appropriate SD card. The result of this is that the chart is carrying far, far more information than it can show nearly all the time.
If you were looking at the English Channel and it threw up everything it has to tell, it would be unreadable because of all the clutter that nobody needs when out in deep water. To combat this, the software and/or the chart reduce the data to layers. Starting at full zoom in our local creek, it gives us all it’s got – or nearly all. As we enter the big estuary outside we zoom out a bit and details start to disappear. By the time the English Channel or Irish Sea fills the screen, very little detail remains. At oceanic scale, there may be nothing but the outline of the continents and a few islands of major importance.
As detail is ‘layered out’, it’s by no means unknown for vital dangers to disappear. They’re still there, but the only way to find them is to zoom in again, and zooming in to make the screen a mile across while planning a 3,000-mile trip becomes somewhat tedious. In any case, who is to say exactly what track the boat will follow as she makes the best of wind and weather? It won’t be the great circle or the rhumb line, that’s for sure, so how do you discover what might, or might not, catch you out? You look at the paper or raster chart, that’s what. Remember, my ARCS rasters at 1:20,000,000 showed both the reefs that sank the two yachts in my introduction, as plain as mooring piles. Yet both remained hidden from those navigators as they sailed merrily along with their vector charts zoomed out too far.
Has there been a datum shift?

After five minutes’ looking for the vector chart datum, this is all we got
An ENC might be perfectly accurate in terms of how one headland or pier relates to another. They usually are, and it’s natural to assume that the little boat sailing across the chart so sweetly is equally precisely placed. This is generally, though not always, true in Northern European waters, but elsewhere it may be anything but. GPS fixes the boat’s position and it can only think in terms of lat/long.
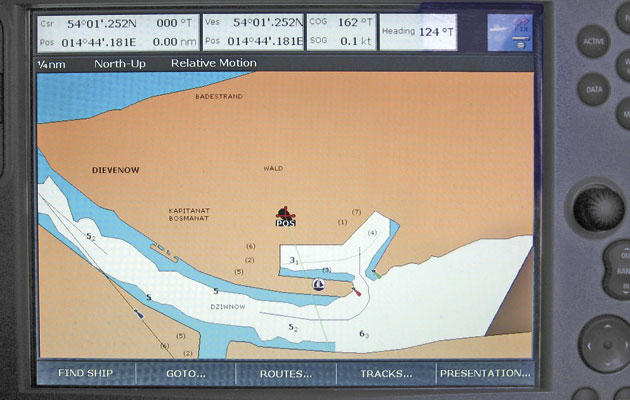
If your plotter is using a datum different to the chart, you could find your yacht ‘afloat’ in a supermarket car park
If the lat/long of the GPS (working to a default horizontal datum and lat/long graticule called WGS84) doesn’t concur with the graticule and datum to which the chart was originally drawn, the boat won’t appear in the right place. The illustration (left) is my own yacht in Poland. She is parked at the supermarket, except she wasn’t. She was floating at the fish dock.
In far-flung places like the Pacific, these ‘datum shifts’ can be miles rather than yards, so relying on a vector chart with no notes to qualify its positional accuracy may lead to a wretched outcome.

Paper and raster charts surrender their datums easily: WGS84
By no means all of the UKHO chart portfolio (6,550+ plans – also its ARCS) works to WGS84. Much of its remote-places material relates to no known datum but at least an Admiralty paper or raster chart tells you clearly where this is the case and warns accordingly.
The UKHO suggests that, without WGS84 referencing, no ENC can be official. Unofficial ENCs are available for just about anywhere. Before using them, ask yourself how the providers of these charts handle the fact that datums are unknown. Then you must find yourself a robust stance for coping with the double whammy of uncertainty.
Practical realities

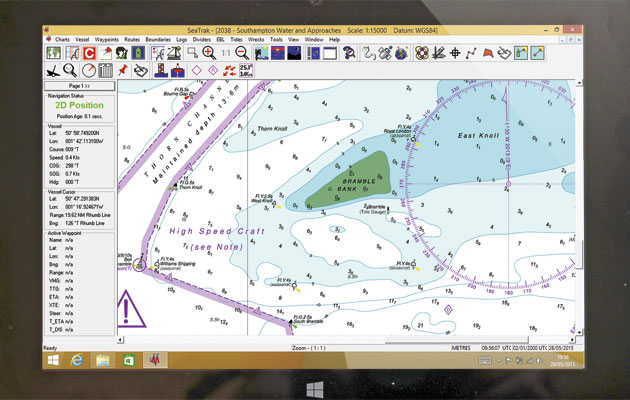
ENCs deliver pinpoint positioning and a projected track to check for hazards, shoals in this case
The overriding benefit of ENCs is an extremely accurate real-time fix. The projected track shows us where the yacht is heading and whether, on the present track, she will pass close to any dangers. These features represent the greatest revolution in navigation since Harrison’s chronometer and, used sensibly, they should result in a similar saving of stress and, ultimately, life.

Take lat/long off the plotter, or put the cursor over a known object and read the range and bearing

Then double check it with a hand-bearing compass
Examining Yachtmasters, I’m often saddened by the amount of time failed candidates spend poring over charts when they would be better off on deck encouraging the hands and keeping a general overview. ENCs free us up to spend less time at the chart table. It’s often enough to duck below on the hour, log the position as lat/long or as range and bearing to a known point by placing the cursor over a useful feature and reading it off. Enter this in the log book with distance and time, fill in one or two other boxes, decide whether you’re on course and, if not, quickly work up a different one. That’s it.
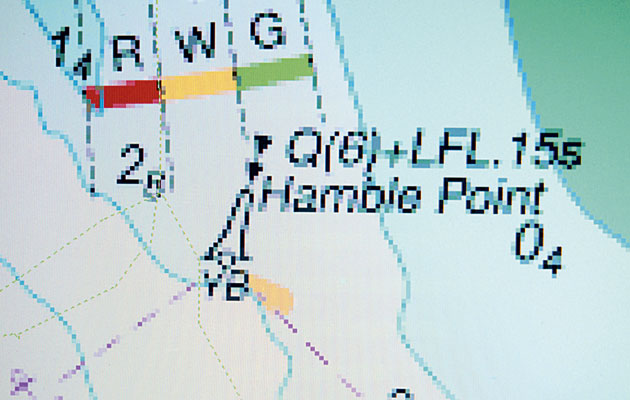
Getting at the specifics

Raster gives it all up: Hamble Point is a south cardinal buoy flashing quick six and a long flash every 15 seconds
Many vector charts have an infuriating feature whereby navigation aids such as buoys and beacons are not obviously recognisable. You may reasonably suspect a green blob alongside a deep-water channel to be a buoy.
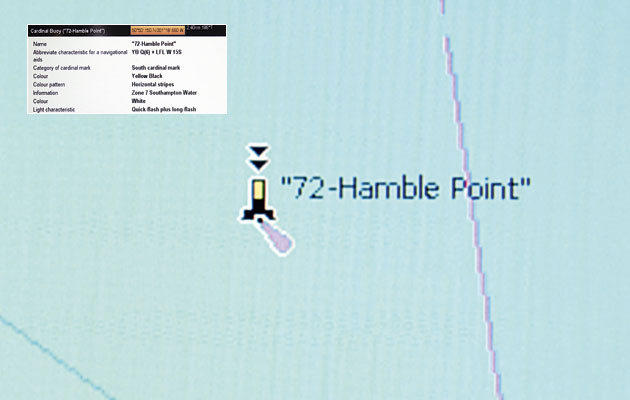
A vector chart shows that Hamble Point is a south cardinal, but it needs four clicks to get any more information
To find out, you must hover the cursor over it and interrogate a pop-up menu that could announce it to be a beacon flashing green once every ten seconds. On a raster chart such aids are instantly recognisable: a huge advantage on a nasty night.
A second sorry situation is to do with depths. A vector chart might indicate a depth contour suggesting an isolated shoal with no obvious depth reading. When interrogated, the pop-up advises that it is ‘between 2 and 10 metres’, or some such useless commentary. Even worse is the ‘rock, always below the surface’. Thank you very much, but how far below? An ARCS chart of the right scale tells all it knows.
‘Bolt-on’ functionality
It’s readily possible to buy vector charts to run on a PC or a Mac (at last), and many professional race navigators or long-term cruisers prefer this approach. It can be cheaper and more flexible, allowing the loading of alternative makes of chart and bolt-ons like weather routing. Some programs such as Euronav also allow the user to alternate between raster and high-quality vector charts and, as we will see, this has much to recommend it.
Close-in pilotage
As a pilot book writer, I often check the transits and bearings I have given for conventional piloting, using my tablet with an ENC to see what’s really going on. This can be a serious confidence builder entering a strange harbour in the dark. By and large, in home waters, I have found vector charts and the GPS hook-up to be reliable enough, but it doesn’t do to forget some important things:
Survey quality
A chart is only as good as the survey from which it was built. If the area in question was surveyed with a lead line in the 19th century then piloting to the limits of a three-decimal place GPS fix is a bit of a joke. Paper and raster chart should contain data about the surveys. Trying to extract such gems from a typical vector chart plotter is a challenge, if the info is available at all. Bear this in mind.
Overzooming
It’s obvious when you’ve over-zoomed a raster chart, either it simply won’t zoom in any more or the screen pixelates
Overzoom a raster chart and it starts to pixelate so you are under no illusions. A vector chart may be less obliging – some sensibly overlay spots onto the screen if you do, or advise that you have overzoomed somewhere in a corner. With others, you’ll never know.
The risk of overzooming is that otherwise insignificant errors may be magnified into significant ones. Sailing close to a danger at normal scale might not give a clear enough indication of what’s happening, so you keep well clear. If you over-zoom to solve this, everything might look fine until the crunch comes.
Survey for safety

Raster charts tell you how to find safe passage through the rocks, solid old-school pilotage

The vector chart marks every single significant rock in Scilly, but pilotage is up to you
When the pilots of old set up their marks to guide mariners through the rocks to safety, they probably didn’t know where every boulder lay and they certainly didn’t care.
They knew where they were not, however, so they can still tell us where the safe passage lies and we can’t do better than follow them today. The vector chart shows every rock because the cartographer felt that it was more important to show how much data had been collected than it was to give the navigator a clear route through it all. You can draw your own conclusions from this next time you are threading south through the Tresco Flats in the Isles of Scilly.
Passage planning on vector charts
Given suitable software, passage planning on vector charts sounds feasible, but practice doesn’t bear this out. Both yachts in my intro were lost because their plan failed to zoom in through the layers that hid the dangers. No sailing boat since the time of Noah ever stuck to a rhumb line. To zoom close enough onto all possible track variations to check every rock or shoal that may matter just isn’t realistic.
So what to do?
The Team Vestas Wind inquiry concluded, amongst other things, that passage planning undertaken on vector charts should be monitored on suitable paper charts. There is not, it was added, any need to plot the expected track on paper. Careful inspection should suffice to underline anything the layering had obscured on the vector chart. I would concur with this, adding that a raster chart will serve equally well as a check, always given that it suffers from the same screen-size issue as the vector.
Take the best of both worlds

The way to stay safe is never to rely on just one source of navigation. Something you can use on deck is a huge plus
Navigating with a vector ENC confers many advantages. I set my ‘safety contour’ to a suitable colour and reset it depending on the seas I am sailing. The tidal data are a huge labour-saver and there’s more, depending on chart and plotter.
These don’t come without a price, however. There is the issue of overview, the problems attached to layering, including disappearing dangers, datum shifts that lurk unsuspected, forgotten menu adjustments that filter out vital information, and the interrogation required to uncover basic information.
The ideal answer is to run the vector charts and keep a parallel plot on paper or raster, which will instantly throw up any anomalies. These can then be dealt with by locating the position in question on the ENC and zooming in.
I prefer to keep my paper charts for emergencies so I run two plotters: one raster, one vector. The raster chart plotter will show the boat’s position plus a projected track and all the bells and whistles paper cannot give.
£220 buys you an 8in tablet loaded with UK and Ireland ARCS charts
A raster plotter can be inexpensive, too. If you already have a bulkhead vector job, why not invest in a tablet running, say, UK and Ireland ARCS charts as your extra plotter? Or you can run ARCS charts on a PC, as I have for years, alongside my Raymarine E-series.

A GPS plug-in and ARCS software turns Tom’s old laptop into a raster plotter
I bought a GPS dongle that drives the software reliably from below decks and if I want a plotter in the cockpit, I can use ARCS or Imray rasters on tablet, or Navionics vectors on iPad. Another option is a PC program such as Euronav that can switch between vector and raster charts.
On the whole, vector charts do a good job. So long as we understand their weaknesses, ask them the right questions and back them up to cover their shortfalls, they can liberate us from navigational stress for good.
‘Don’t throw out the baby with the bathwater!’

To check you’ve entered a waypoint correctly, hit ‘Goto’ before you set off and make sure its position, range and bearing are just as you would expect
In this case, the bathwater is the paper chart, dividers, pencils and protractors that kept us safe for generations. The baby is the philosophy that went with them.
Probably the most important single safety valve in traditional navigation has always been to seek data from as many sources as are available. Taking a compass-bearing fix, we all know to go for three position lines, not just two, because if we only have two and one is adrift, there is no way of spotting an error, much less of quantifying it. A sound navigator also makes a point of noting the depth reading. After plotting the fix, he can then check it against the depth. If that very different source concurs, he can be reasonably confident of his position.
Navigating with GPS and a paper chart, anyone who wants to stay out of trouble cross-checks GPS fixes and waypoints with other sources of info. The fix is almost certainly good, but what about our pencil plot, or the numbers we’ve punched in for the waypoint? The only way to be sure is to gather data from more than one source as we always have done.
Many still prefer to run a paper plot, or at least have a good-scale paper chart open on the table to check for anything the vector system, aided and abetted by us, might have missed. When navigating with a vector chart, always make sure you’re covered.